Insights
Transform your construction project data into
actionable insights with customizable dashboards,
real-time updates and advanced visualization tools.


You can create your own dashboard customized
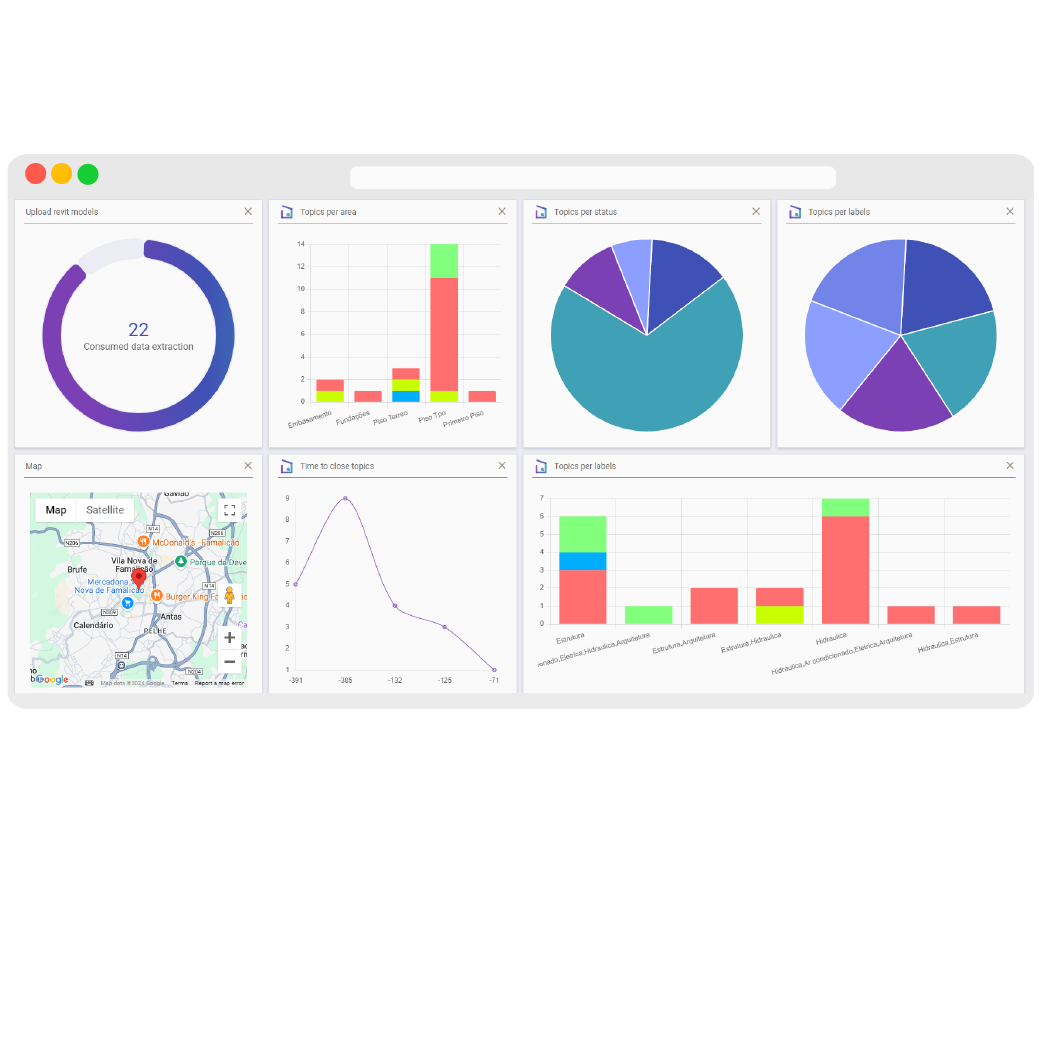
Design custom dashboards that cater to your specific project needs, providing instant access to critical information.
- Custom Dashboard Creation: Easily create unlimited new dashboard pages for your project, allowing you to organize and display data in a way that best suits your team’s workflow.
- Analyze your project in a simple way: Dashboards are important for checking your project information and analyzing issues and project progress quickly and immediately.
- Permissions: Define who can view and edit your dashboard or keep it private only for you.
- Drag-and-Drop Interface: Easily create and organize dashboard pages with a simple drag-and-drop interface, no coding or complex setup required.
Dashboards
Have maximum flexibility and control over how you monitor your project.
Visualize Complex Data
Transform complex datasets into easy-to-understand visuals, ensuring that everyone on the team can interpret the data quickly.

Information Updated in Real Time
Monitor your project’s progress in real-time, with data across your dashboards automatically updated to reflect the latest information.

No Refresh Required
Dashboards refresh automatically as new data comes in, eliminating the need for manual updates and ensuring your team always has the most up-to-date information.

Widgets & Graphics
per module
All BIMWorkplace modules will have specific widgets for each one of them.
You will be able to analyze your project from Insights dashboards.

Models Elements
Take control of the elements of your models through dynamic graphics, you can see all the elements contained in your project. You can use the mouse scroll to get a closer or more general view.

Topics per Milestone & Label
Take control of your topics by project phase. Know exactly how many issues you have for each phase of the project. Also organize it by engineering discipline. You will be able to more easily analyze which models have the most issues.

Topics per Area & Type
Get a better sense of which areas of the model have the most topics. You can divide your topics by type, such as clash, information discrepancy or omission. Know exactly the problems of your model and solve them.

Topics per Status & Priority
Analyze your topics by status. You can categorize your topics' status from "new", "approved", "closed" and much more. The priority chart allows you to have a clear view of the number of pending issues to be resolved and their degree of importance.

Topics per User & Group
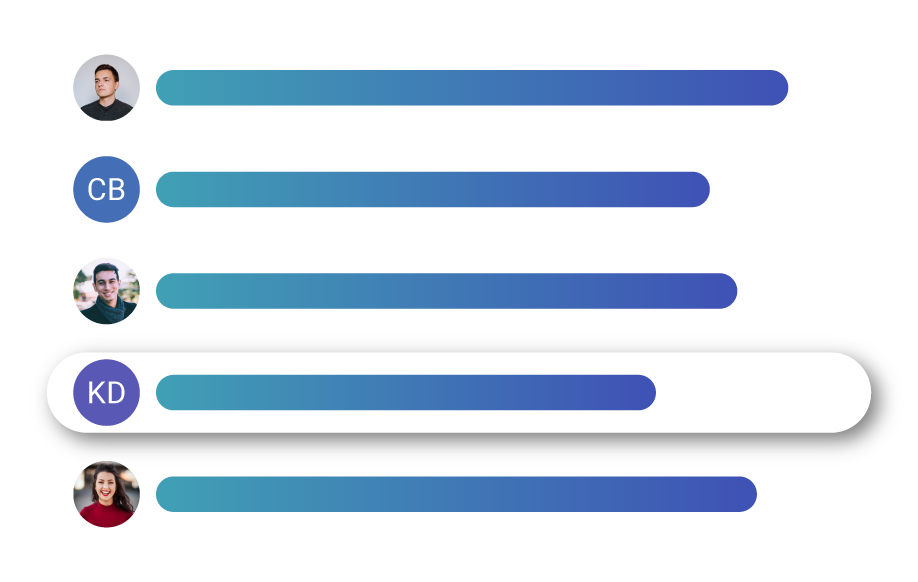
The best way to organize your team is to know how many topics each team member has assigned. For an overview, you can find out which topics each workplace group has access to. Organizing your team has never been so simple.

Topics Timeline
Organize your team's work with a chart that summarizes project topic deadlines. Know exactly how many days you have to resolve a certain number of topics and which ones are already overdue. Control work peaks and define everyone's priorities well.