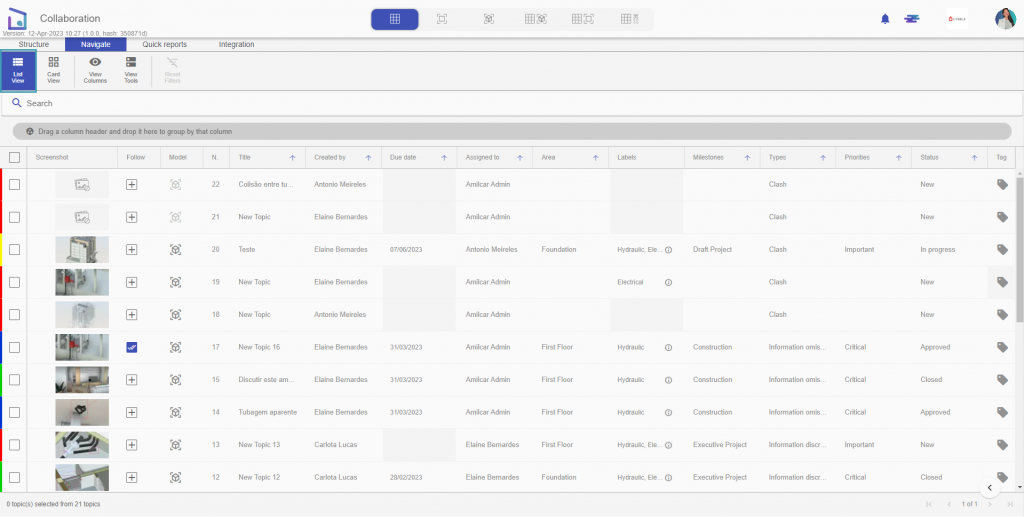
To facilitate the visualization of the topics, you can choose the visualization mode that is most useful and convenient for you. By default, whenever the Collaboration module is started, it appears in list view.
This view mode offers a more complete view of the topic, allowing you to view, along the various columns, all the data fields related to the topic in question. In addition, there is also the possibility of ordening and grouping the columns.
Each topic has an assigned color, as seen on the left edge of the table below. The colors represent the status of the topic and can be customized in the project settings in Project Data Fields.
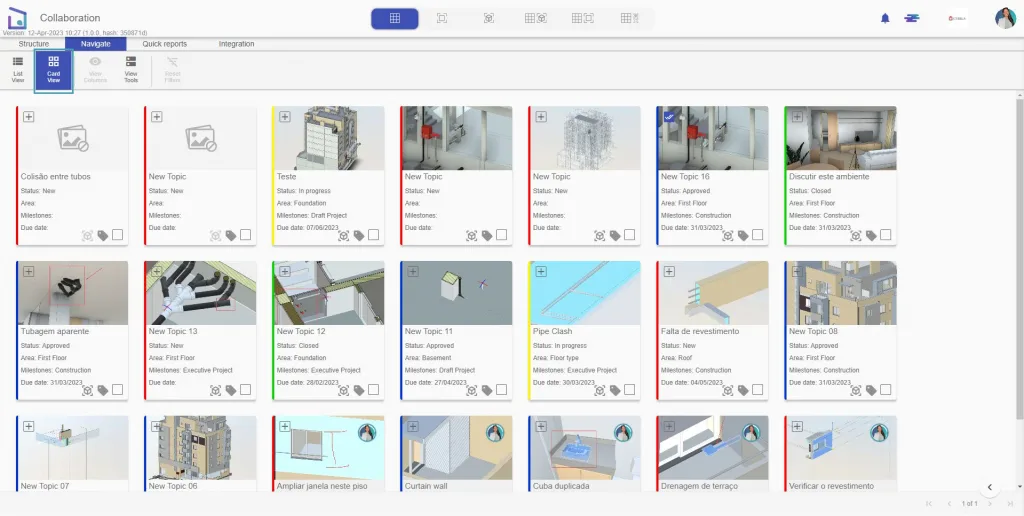
On the other hand, the card view provides a summarized view of topic information. Each card refers to a topic, thus containing the main information of that same topic, as well as the tags, the go to model and the follow.
As in the previous visualization mode, in this visualization mode we can also observe, at the extreme left of the table, a color assigned to each topic, in order to facilitate the analysis of the state in which it is found.
Now that you know the two modes of viewing the topics, you can choose the one most comfortable for working with the data and situations reported on a daily basis!